How much was dinner last night? You likely remember. The appetizer, the entrée, the glass of wine, and exactly how much it all cost. Why? Because it’s all itemized clearly on the check and cleanly tallied at the bottom. Every order, every dollar. That’s normal. In fact, expected.
Now ask yourself: How much do you pay for your financial support?
If you’re like most investors, the answer isn’t nearly as clear. Investment fees aren’t always served up like a dinner bill. They’re fragmented, obscured in footnotes, and scattered across custodial statements, fund disclosures, and advisory agreements. You might be able to piece it together. But you shouldn’t have to.
Here’s What’s Often in the Mix
- Direct advisor fees
- Asset management fees (e.g., mutual fund fees)
- Trading and transactional costs
- Performance or incentive fees
- Platform or custodial fees
Sometimes these appear on your statement. Sometimes you have to look a bit harder. But almost never is there one clear, total cost—one line that says: This is what you paid.
We’re Doing It Differently at Poxono
We built Poxono Capital to solve this problem for investors. We believe you deserve to know what you’re paying and what you’re getting in return. Long-term investment health is too important for the true cost to remain a mystery.
That means:
- Transparent pricing
- Minimal friction
- A direct link between your capital and the decisions being made on your behalf
We’re applying a hedge-fund discipline to long-term investing, bringing Wall Street expertise to Main Street with humility, purpose, and clarity. We focus on what matters and strip out what doesn’t. One clear strategy. One readable bill. One final cost.
What Might That Mean in Dollar Terms?
Let’s go back to our original fee mix and outline what we estimate are average costs per investment account:
| Type of Fee | Estimated Average Cost (%) |
| Direct Advisor Fees | 1.15% |
| Asset Management Fees | 1.13% |
| Trading / Transaction Costs | 0.15% |
| Total Estimated Fee Load1 | 2.43% |
Keep in mind this estimate does not include:
- Ongoing platform fees
- Performance or incentive fees
- Front-end or back-end sales loads (which for front-end loaded funds could reach 5.75% in certain cases)
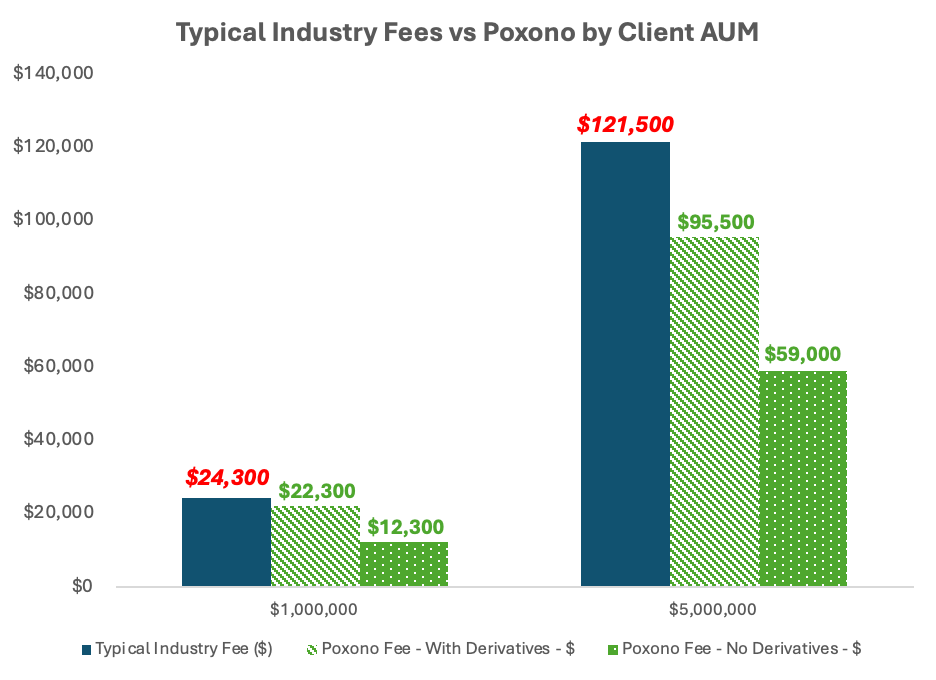
Overall, we believe this estimate to be very (very) conservative. Nonetheless, what does that mean in dollar terms and how might Poxono compare?
$2,000. $36,000? Either way, those fee advantages are actual dollars. Back in your hands. Every single year.
What Are Investors Getting for All Those Fees?
Too often, not much.
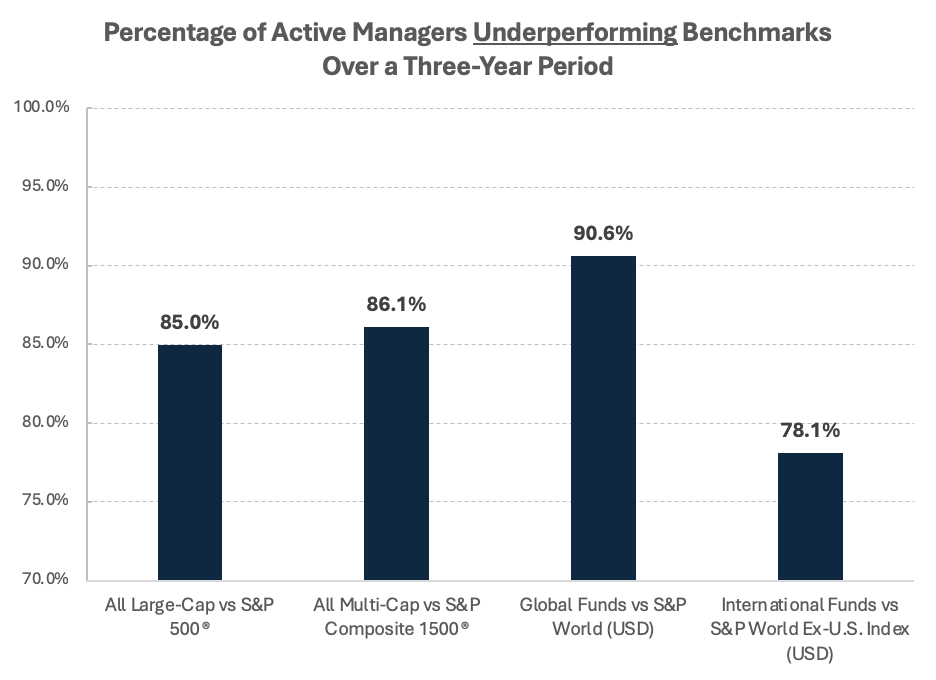
According to a recent Morningstar study,2 more than 8 out of 10 active equity managers underperformed their benchmarks over a 3-year period. And it doesn’t get better the further you extend the duration of time.
Mathematically, you’d be much better off flipping a coin, or better yet, driving to a casino.
At least there, they serve free drinks.
Put Your Money Back in Your Pocket
Far too often investors pay top dollar for lackluster results largely owing to embedded costs, not investment skill.
We built Poxono because we weren’t willing to accept the status quo. And wanted to build something better. In fact, our firm’s name was born from the simple prompt: “What would you build if you were doing it solely for the benefit of family and friends?”
To us that’s a performance-first approach through thoughtful portfolio construction and long-term discipline. Small, marginal enhancements that ultimately add up to meaningful results over the long run.
Importantly, one clear bill, no hidden fees. Putting your money back in your pocket.
Let us help you understand how much you’re paying for your financial support. Efficiency is attainable for any portfolio, and it may already be a key characteristic of yours. If not, perhaps you can put these potential savings towards your next dinner.
If you’re tired of hidden fees and want to understand exactly where your money is going, get in touch with the team at Poxono today. Let’s build a plan that puts more of your dollars back where they belong—working for you.
Schedule A
| Client Portfolio AUM | Typical Industry Fee (%) | Typical Industry Fee ($) | Poxono Fee – No Derivatives – % | Poxono Fee – No Derivatives – $ | Annual Cost Savings – No Derivatives | Poxono Fee – With Derivatives – % | Poxono Fee – With Derivatives – $ | Annual Cost Savings – With Derivatives |
| $1,000,000 | 2.43% | $24,300 | 1.23% | $12,300 | $12,000 | 2.23% | $22,300 | $2,000 |
| $5,000,000 | 2.43% | $121,500 | 1.18% | $59,000 | $62,500 | 1.91% | $95,500 | $26,000 |
1. These figures reflect a hypothetical scenario, are meant to be educational and may not be applicable to all investor scenarios. Total estimated fee load was calculated using a blend of information and services from several large, well-known registered investment advisors, including but not limited to Oppenheimer, Edward Jones, Raymond James and Northwestern Mutual. Current proprietary client data was also incorporated. Please see Schedule A for further calculations.
2. Please see https://www.spglobal.com/spdji/en/research-insights/spiva/ for further information. Data as of December 31, 2024.